July 23rd, 2026
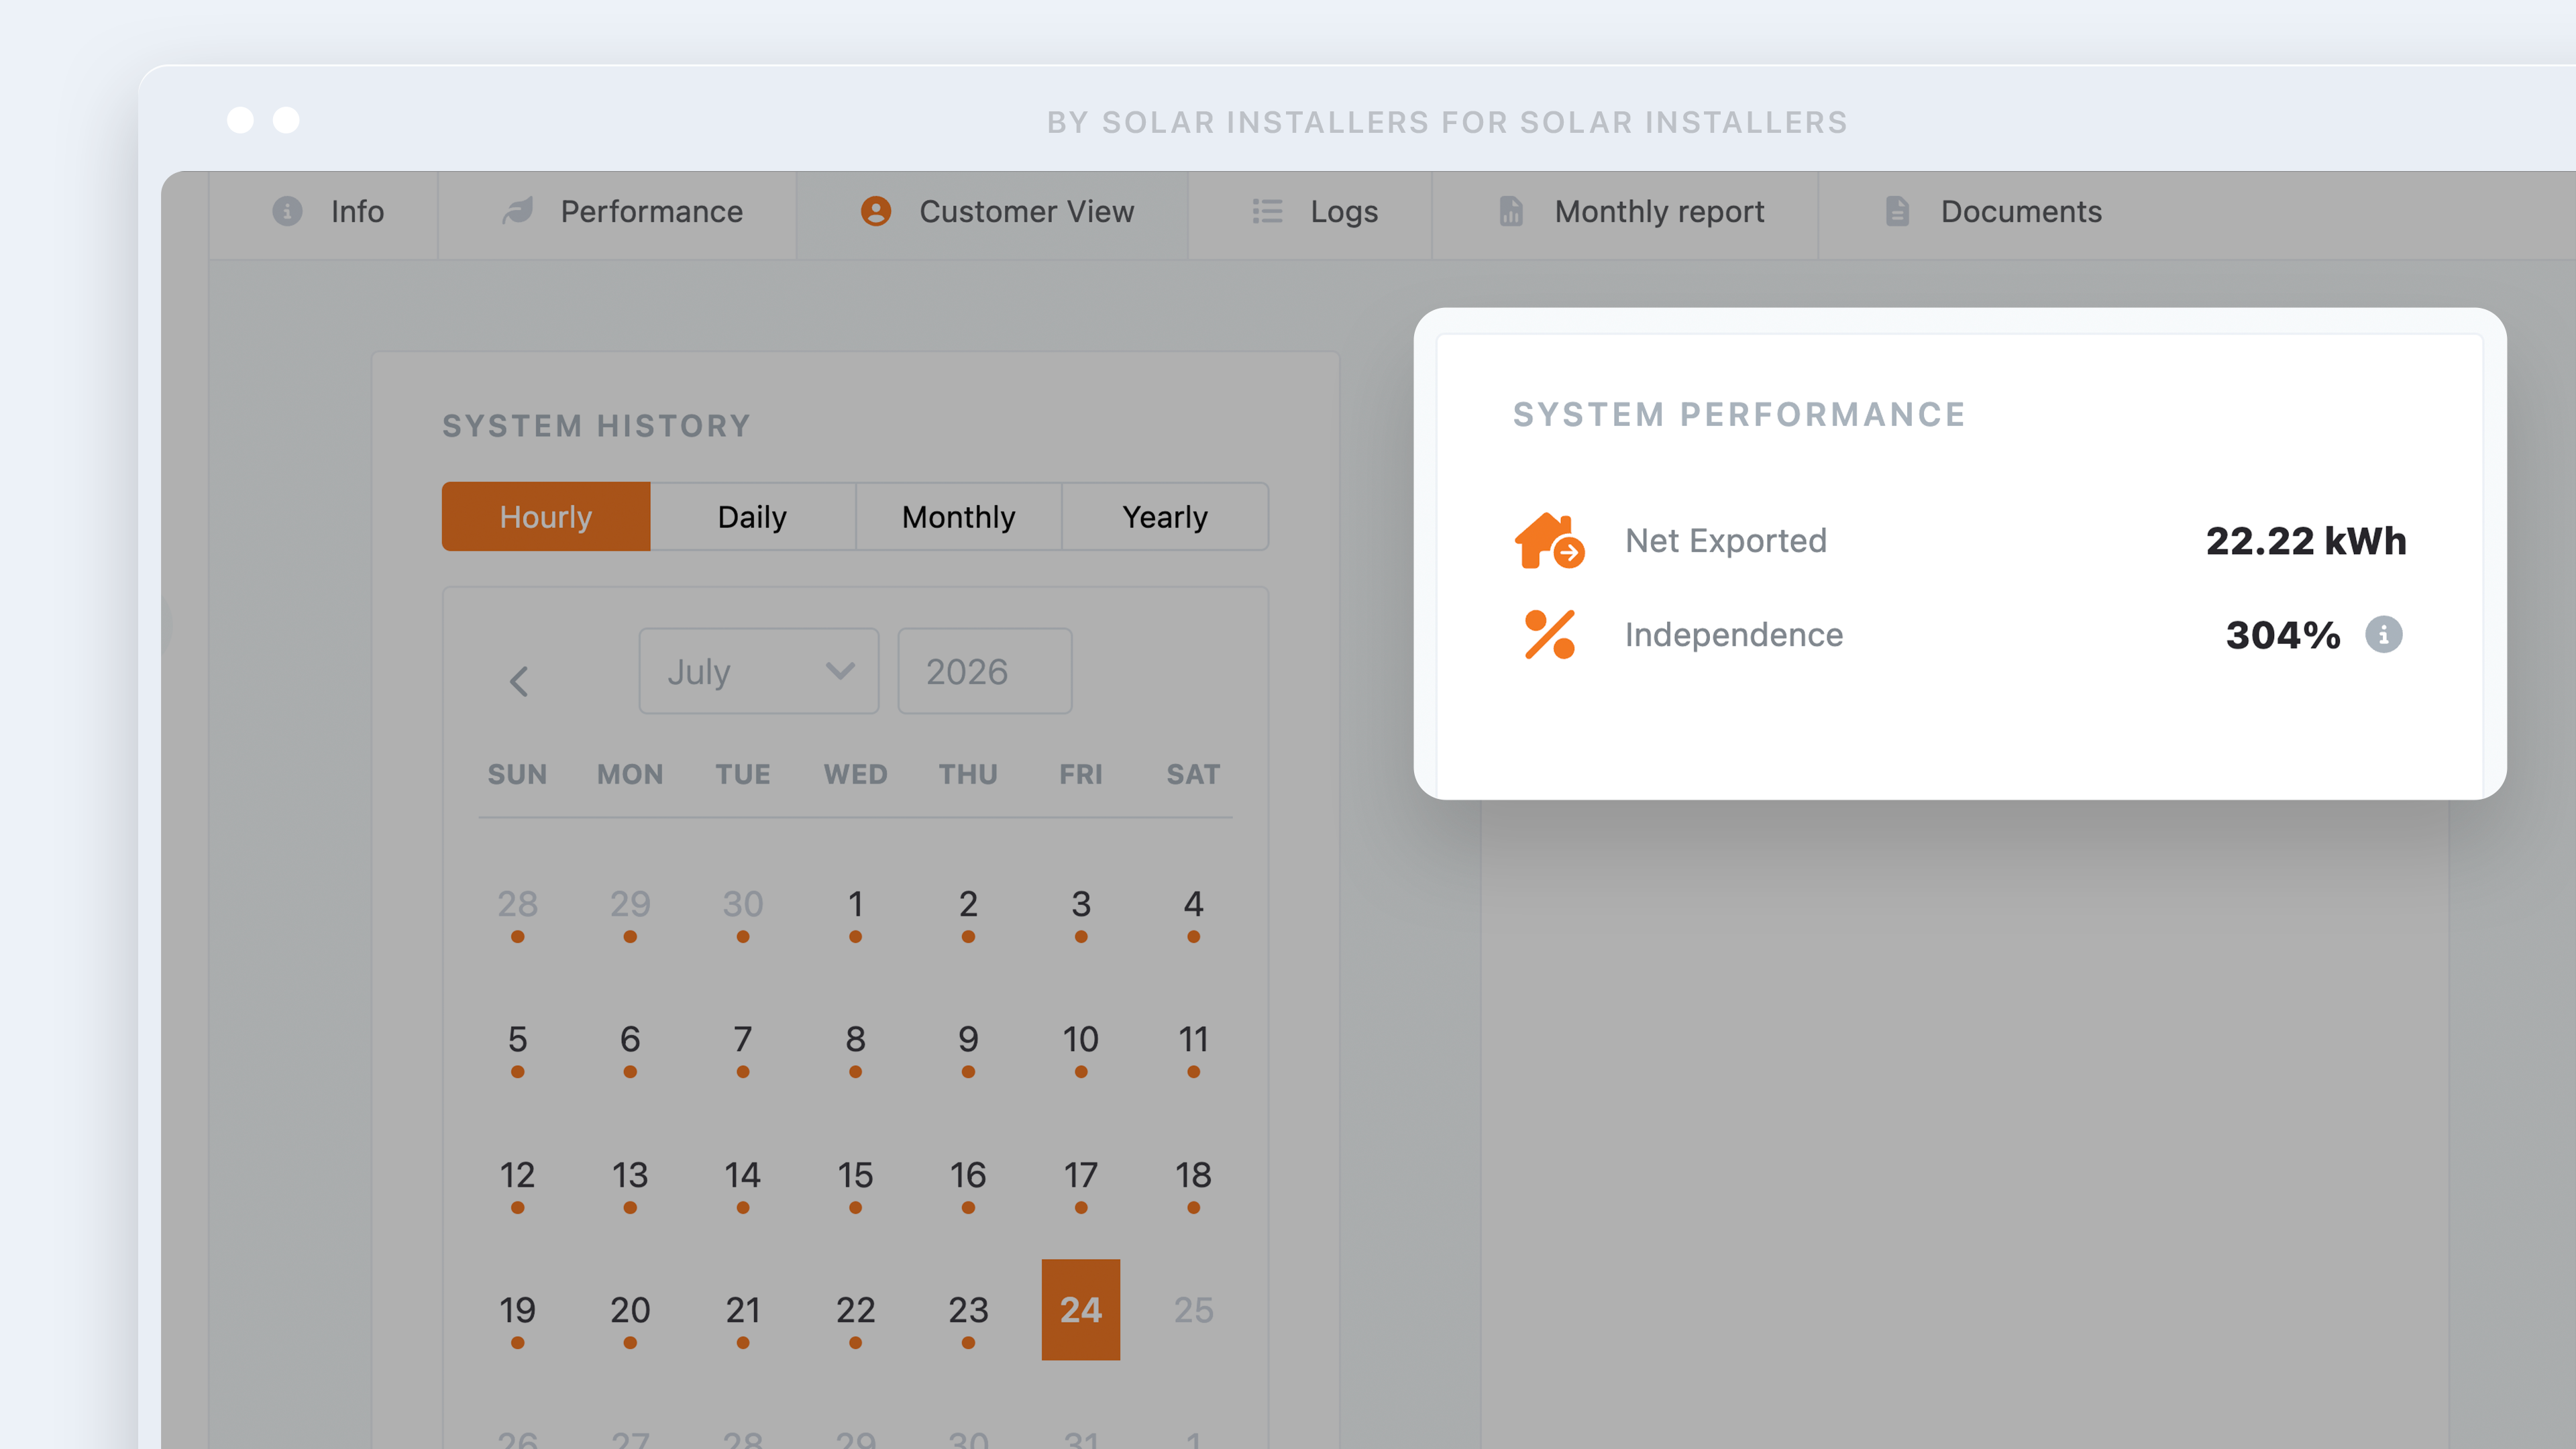
Net Energy and Solar Independence Added to the Performance Widget
Homeowners can now see their net energy position and solar independence directly in Sunvoy’s performance widget, alongside production and consumption data.
Why This Matters
Production totals alone do not always tell homeowners how much of their electricity use is actually being covered by solar.
These new metrics make the relationship between generation and household demand easier to understand. Customers can quickly see whether they relied on the grid or sent excess solar energy back to it, as well as the percentage of their consumption supplied by their solar system.
This gives installers a clearer, more complete way to explain system performance without requiring homeowners to calculate the difference themselves or check a separate manufacturer portal.
How It Works
Sunvoy uses the system’s production and consumption data to calculate two additional metrics:
Net energy shows the difference between production and consumption. Depending on the result, the widget displays either Net Imported or Net Exported in kilowatt-hours.
Solar independence shows the percentage of household consumption covered by solar production during the selected period.
For example, when a home consumes more energy than the system produces, Sunvoy displays the remaining amount as net imported from the grid. When production exceeds consumption, the excess is displayed as net exported.
Both metrics appear within the existing performance widget, giving homeowners a more complete view of how their system is serving the home.